Component Costing System
Costing is where design decisions become financial consequences. Every material choice, every component swap, every manufacturing change has a cost — but before this system existed, understanding that cost meant navigating spreadsheets nobody fully trusted, reconciled manually across teams working from different numbers and different definitions of the same word.
I was brought in as Director of UX to lead the design of a tool that connects component-level cost detail to product-level margin impact — making financial consequences visible at the exact moment design decisions are being made. But before any screen could be designed, Finance, Costing, and Product Creation had to agree on what the numbers meant. That alignment was the job.
Role & Scope
- Role: Director of UX — led team of designers and researchers
- Scope: Costing workflows, margin impact views, component-level cost hierarchy, engineering handoff documentation
- My work: Team leadership, SME engagement, workflow definition, prototyping, cross-functional alignment, executive presentations, engineering handoff
- Partners: Finance, Costing, Product Creation, Engineering Directors, Operations — aligned at Director level across functions
The real problem
The hardest constraints were organizational, not technical. Finance teams needed precision. Design teams needed speed. Costing teams needed flexibility for exceptions, vendor negotiations, and special pricing rules. None of them were working from the same definition of "cost." Getting that alignment — what counts as a component cost, how labor minutes map to dollar values, what "margin impact" means at the product level — required Director-level negotiation across three functions before a single screen was designed.
The objective wasn't "more data." Nike already had cost data — it was scattered, siloed, and interpreted differently by every team that touched it. The objective was shared understanding: one place where design, costing, and finance could look at the same numbers, with the same definitions, and make decisions together rather than arguing about whose spreadsheet was right.
- No shared definition of "cost" across Finance, Costing, and Product Creation
- Cost data scattered across spreadsheets with no single trusted source
- Exception-heavy workflows: vendor constraints, negotiated costs, seasonal deadlines
- High-stakes decisions made under time pressure with limited tolerance for ambiguity
How we got there
I led the team to treat costing as a decision system — mapping the moments where teams choose a direction, then designing views that make tradeoffs visible at exactly those moments. The approach was progressive: start with the alignment work nobody wanted to do, then build the system on top of agreed definitions.
- Engaged SMEs across Finance, Costing, and Product Creation to map current workflows and identify where decisions stalled
- Drove cross-functional alignment on shared cost definitions — the prerequisite for any UI to hold
- Designed a progressive disclosure hierarchy: component → group → product, so expert and non-expert users could navigate at the right level of detail
- Used color-coded cost types — blue for materials, green for labor — to reduce cognitive load in dense tables without sacrificing accuracy
- Built Sandbox Mode for real-time cost modeling — teams adjust variables and see margin impact before committing to a decision
- Produced detailed engineering handoff documentation with numbered annotations, behavior specs, and edge case guidance — reducing implementation drift across distributed teams
- Ran testing sessions with the full Costing group using real data — not just SMEs — to validate comprehension and accuracy at scale before Phase 1 release
The work
Engineering handoff — Design doesn't end at delivery
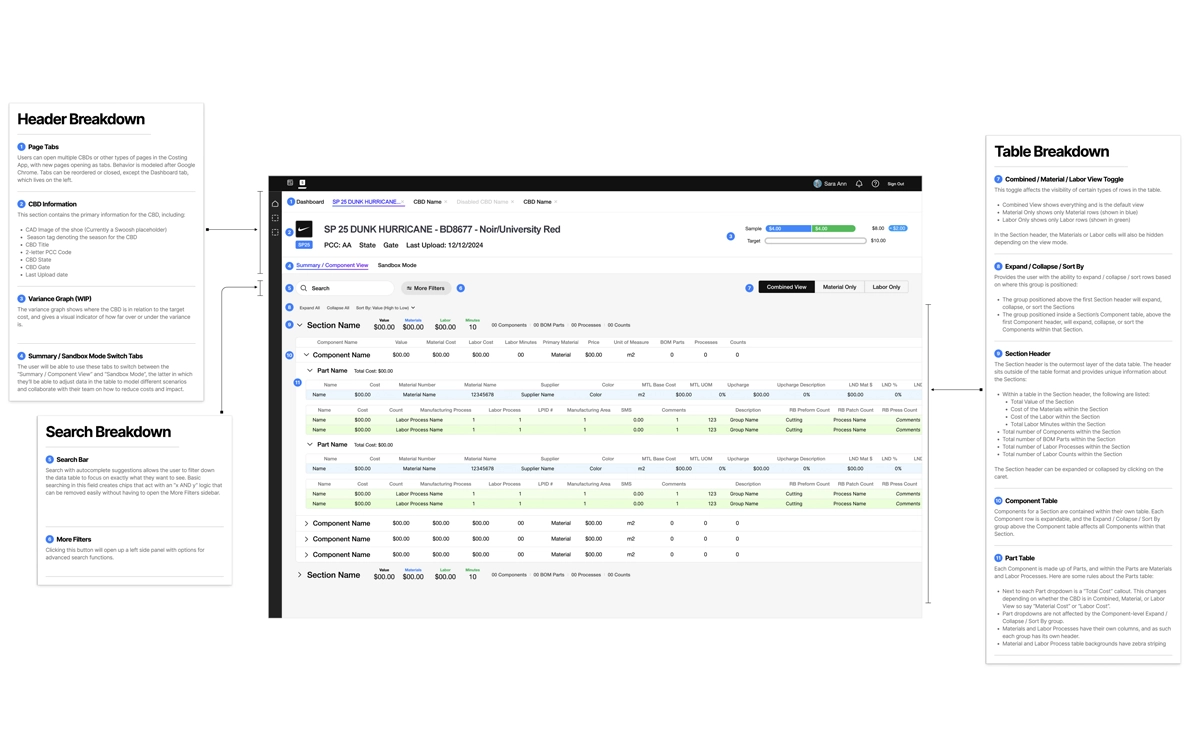
Annotated CBD view — numbered component breakdowns, behavior specs for every interactive element, edge case documentation, and explicit notes on features still in progress. At director level, the handoff is as much a design artifact as the screens. Clear documentation reduces implementation drift and gives engineering the confidence to build without constant clarification loops.
Combined view — Making financial complexity readable
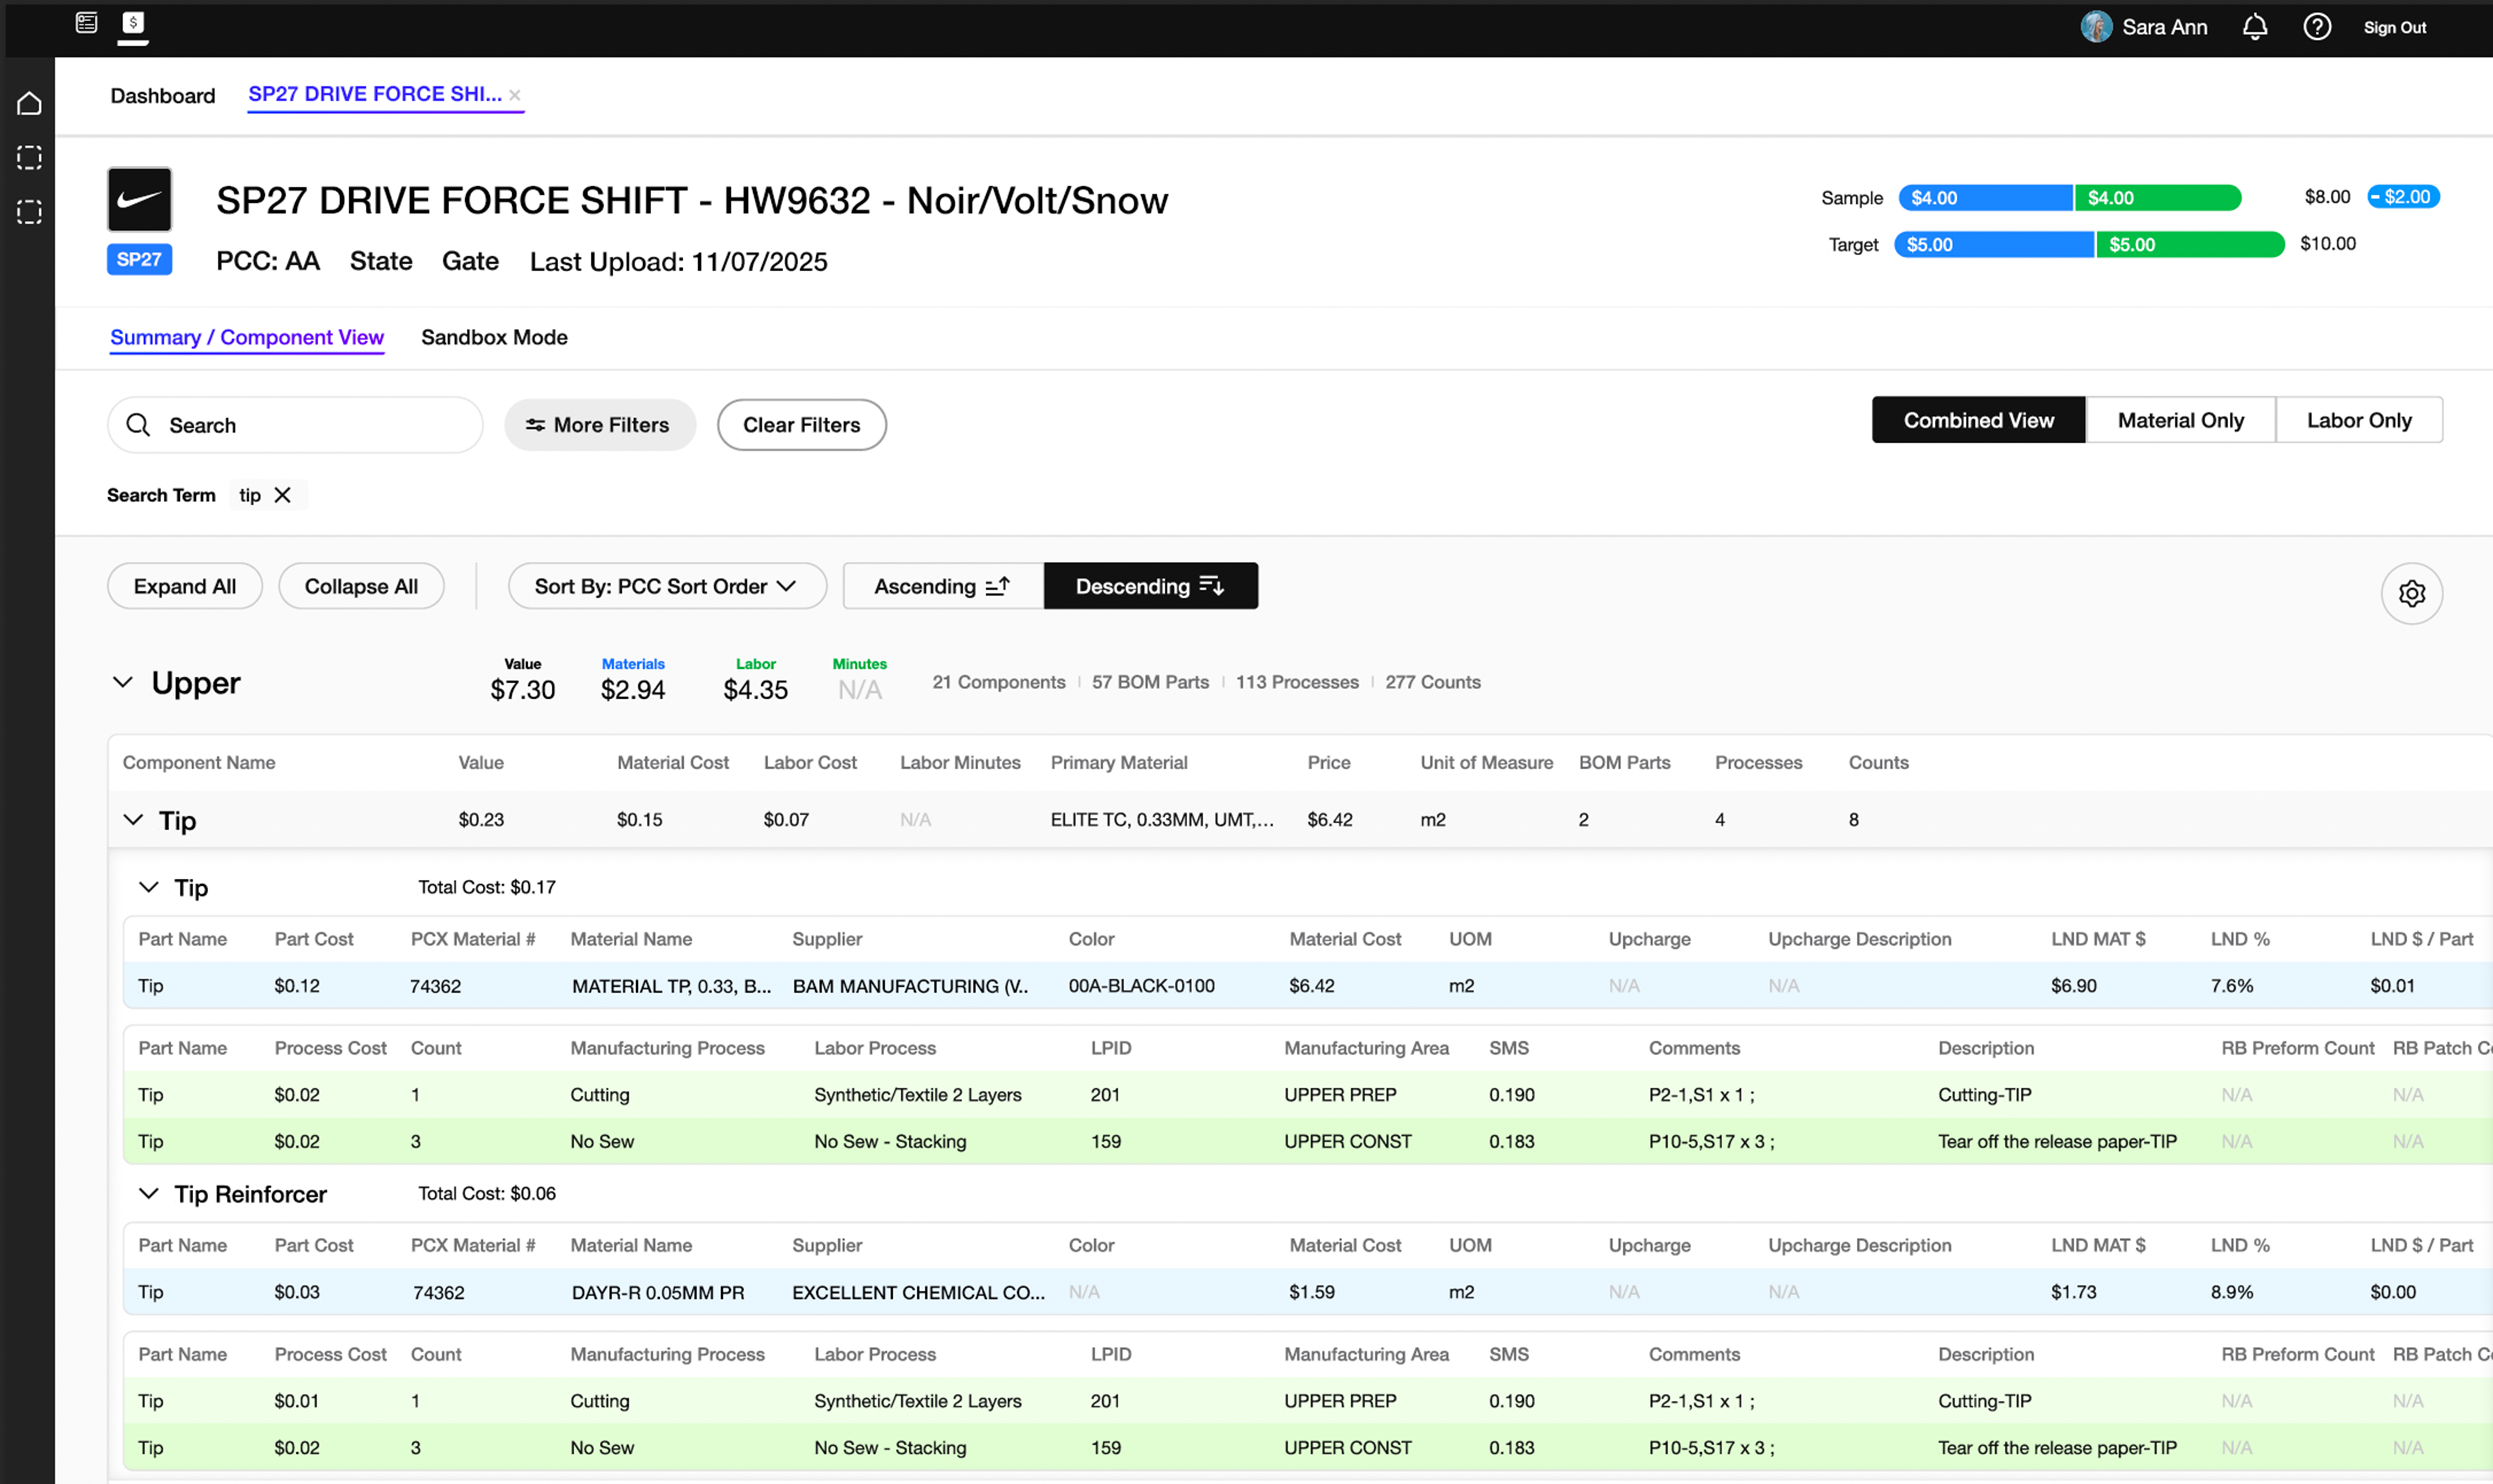
Progressive disclosure from section to component to part — each layer revealing detail only when the user needs it. Color-coded cost types, expandable rows, and a combined/material/labor toggle let users find the signal without drowning in data they don't need. Sandbox Mode lets teams model scenarios before committing.
What early testing validated
The system was in active development when my tenure ended. These outcomes reflect what was demonstrated in testing before Phase 1 release — not post-launch metrics.
- +20% improvement in data accuracy and readability — validated with the full Costing group using real production data
- Measurable reduction in time spent reconciling information across spreadsheets and disconnected tools
- Earlier identification of margin risk through component-level cost visibility before decisions commit
- Shared cost definitions established across Finance, Costing, and Product Creation — the first time these teams had agreed on a common language
- Engineering handoff documentation structured to preserve design intent through continued buildout after my departure
- Reusable patterns integrated directly into the Gemini BOM ecosystem — consistent language across both systems
What this taught me
The most important work on Component Costing happened before any screen was designed. Getting Finance, Costing, and Product Creation aligned on shared definitions was harder than any interaction problem we faced — and it was the prerequisite for everything else. Until teams agreed on what the numbers meant, no interface improvement could hold.
This is the pattern I've seen across every complex enterprise system: the design problem is usually downstream of an alignment problem. Solving the alignment problem first — even when it's slower, even when it requires Director-level negotiation across three functions — is what makes the design work stick.
Part of the Nike product creation ecosystem
Component Costing and Gemini were designed to work together — shared data, shared definitions, shared patterns. The BOM tells you what a product is made of. Costing tells you what it costs to make it. They're two sides of the same decision.
View Gemini BOM → View Apollo →